Google Advanced Data Analytics Professional Certificate

Google Advanced Data Analytics Professional Certificate
Kitholt FrankWhat is RACI matrix?
R: Responsible (The one who mainly does this job or task)
A: Accountable (The one who is the manager of this job)
C: Consulted (The one who can offer some good ideas or thoughts to this task)
I: Informed ( The one who is well kept imformed)
Those 4 elements enable companies to organize their employees.
Interview questions for applying data analyst
Course 1
- As a new member of a data analytics team, what steps could you take to be fully informed about a current project? Who would you like to meet with?
- How would you plan an analytics project?
- What steps would you take to translate a business question to an analytical solution?
- Why is actively managing data an important part of a data analytics team’s responsibilities?
- What are some considerations you might need to be mindful of when reporting results?
Course 2
- Describe the steps you would take to clean and transform an unstructured data set.
- What specific things might you review for as part of your cleaning process?
- What are some of the outliers, anomalies, or unusual things you might consider in the data cleaning process that might impact analyses or the ability to create insights?
Course 3
- How would you explain the difference between qualitative and quantitative data sources?
- Describe the difference between structured and unstructured data.
- Why is it important to do exploratory data analysis (EDA)?
- How would you perform EDA on a given dataset?
- How do you create or alter a visualization based on different audiences?
- How do you avoid bias and ensure accessibility in a data visualization?
- How does data visualization inform your EDA?
Course 4
- How would you explain an A/B test to stakeholders who may not be familiar with analytics?
- If you had access to company performance data, what statistical tests might be useful to help understand performance?
- What considerations would you think about when presenting results to make sure they have an impact or have achieved the desired results?
- What are some effective ways to communicate statistical concepts/methods to a non-technical audience?
- In your own words, explain the factors that go into an experimental design for designs such as A/B tests.
Course 5
- Describe the steps you would take to run a regression-based analysis.
- List and describe the critical assumptions of linear regression.
- What is the primary difference between R2 and adjusted R2?
- How do you interpret a Q-Q plot in a linear regression model?
- What is the bias-variance tradeoff? How does it relate to building a multiple linear regression model? Consider variable selection and adjusted R2.
Course 6
- What kinds of business problems would be best addressed by supervised learning models?
- What requirements are needed to create effective supervised learning models?
- What does machine learning mean to you?
- How would you explain what machine learning algorithms do to a teammate who is new to the concept?
- How does gradient boosting work?
How 2 communicate efftively?
PACE framework (https://medium.com/@andersongimino/the-pace-stages-12206e1ea536)
- Plan
- Analyze
- Construct
- Execute
EDA(6 steps)
- Discovering
- Structuring
- Cleaning
- Joining
- Validating
- Presenting
Manipulate date
A important function called ‘to_datetime’ which can turn date string into date object.
Methods for handling missing data
- Ask the owner of dataset
- Just drop those NaN columns or rows
- Create a NaN category
- Use proper value to fill missing data
Account for outliers
- Draw boxplots to find outliners
- ==Z-score==
Statistics
- Central tendency(Mean, Median, Mode)
- Dispersion(Standard deviation)
- Position(IQR)
Discrete probability distributions
- 几何分布
- Binomial
- 泊松
- 正态分布
二项分布可以在【大样本( n > 50)小概率 ( p < 0.1)】时近似为泊松分布**,也可以在【大样本 ( np > 5 and nq > 5)】时近似为正态分布**。
泊松分布在【事件频率很高(一般 lambda > 15)】时可以近似为正态分布。
Sampling
- Probability sampling
- Simple
- Stratified
- Cluster
- Systematic(Interval)
- No-probability sampling
- Convenience sampling
- Voluntary response sampling
- Snowball sampling
- Purposive sampling
Hypothesis testing
- Type 1 error(冤枉)- 拒绝真的原假设 - 假阳
- Type 2 error(纵容)- 接受假的原假设 - 假阴
Regression Analysis
What is R2(Square of R)衡量拟合度
https://blog.csdn.net/algorithmPro/article/details/103790316
R2=
Make basic linear regression assumptions
https://blog.csdn.net/qq_34843422/article/details/121594464
- linearity
- Normality(Residuals of errors) 误差满足正态分布(均值为0)
- Independent observation(样本独立)
- Homoscedasticity(误差的方差趋于常数-稳定或者相似)-同方差性
Multiple regression
- The no multicollinearity
方差膨胀系数(variance inflation factor,VIF)
The chi-squared test(卡方检验)
- Chi-squared (χ²) goodness of fit test(拟合度) is a hypothesis test that determines whether an observed categorical variable with more than two possible levels follows an expected distribution.(用于确定某个变量是否可能来自指定的分布。它常常用于评估样本数据是否代表总体)
- Chi-squared (χ²) Test for Independence(独立性) is a hypothesis test that determines whether or not two categorical variables are associated with each other.(用于确定两个分类型或名义型变量是否可能相关)
以下理解概念即可
ANOVA(Analysis of variance)
- One-way(单因子方差分析 (ANOVA) 是一种统计方法,可用于检验三组或更多组的均值差异)
- Two-way
ANCOVA(协方差分析)
引入协变量
M-ANOVA
M-ANCOVA
Logistic regression
Summary
The Nuts and Bolts of Machine Learning
Feature engineering
- Selection(Choose subset of the datasets)
- Transformation
- Extraction
Key evaluation metrics for classification models
- Accuracy
- Precision
- Recall
- F1
Evaluate a K-means model(How 2 find a better K)
- Inertia(惯性): 每个样本与最接近的集群中心点的均方距离的总和, 越小越好,最后为0
- silhouette coefficient metrics(轮廓系数): 集群内其他样本的平均距离记为a,与外部集群样本的平均距离记为b,轮廓系数(b-a)/max(a,b), [-1, 1], 越接近 1 越好
Tree-based modeling
How 2 split
- 基尼系数
- 信息增益
How 2 tune
- max_depth: The maximum depth the tree will construct to before stopping
- min_samples_split: The minimum number of samples that a node must have to split into more nodes.
- min_samples_leaf: The minimum number of samples that must be in each child node for the split to complete.
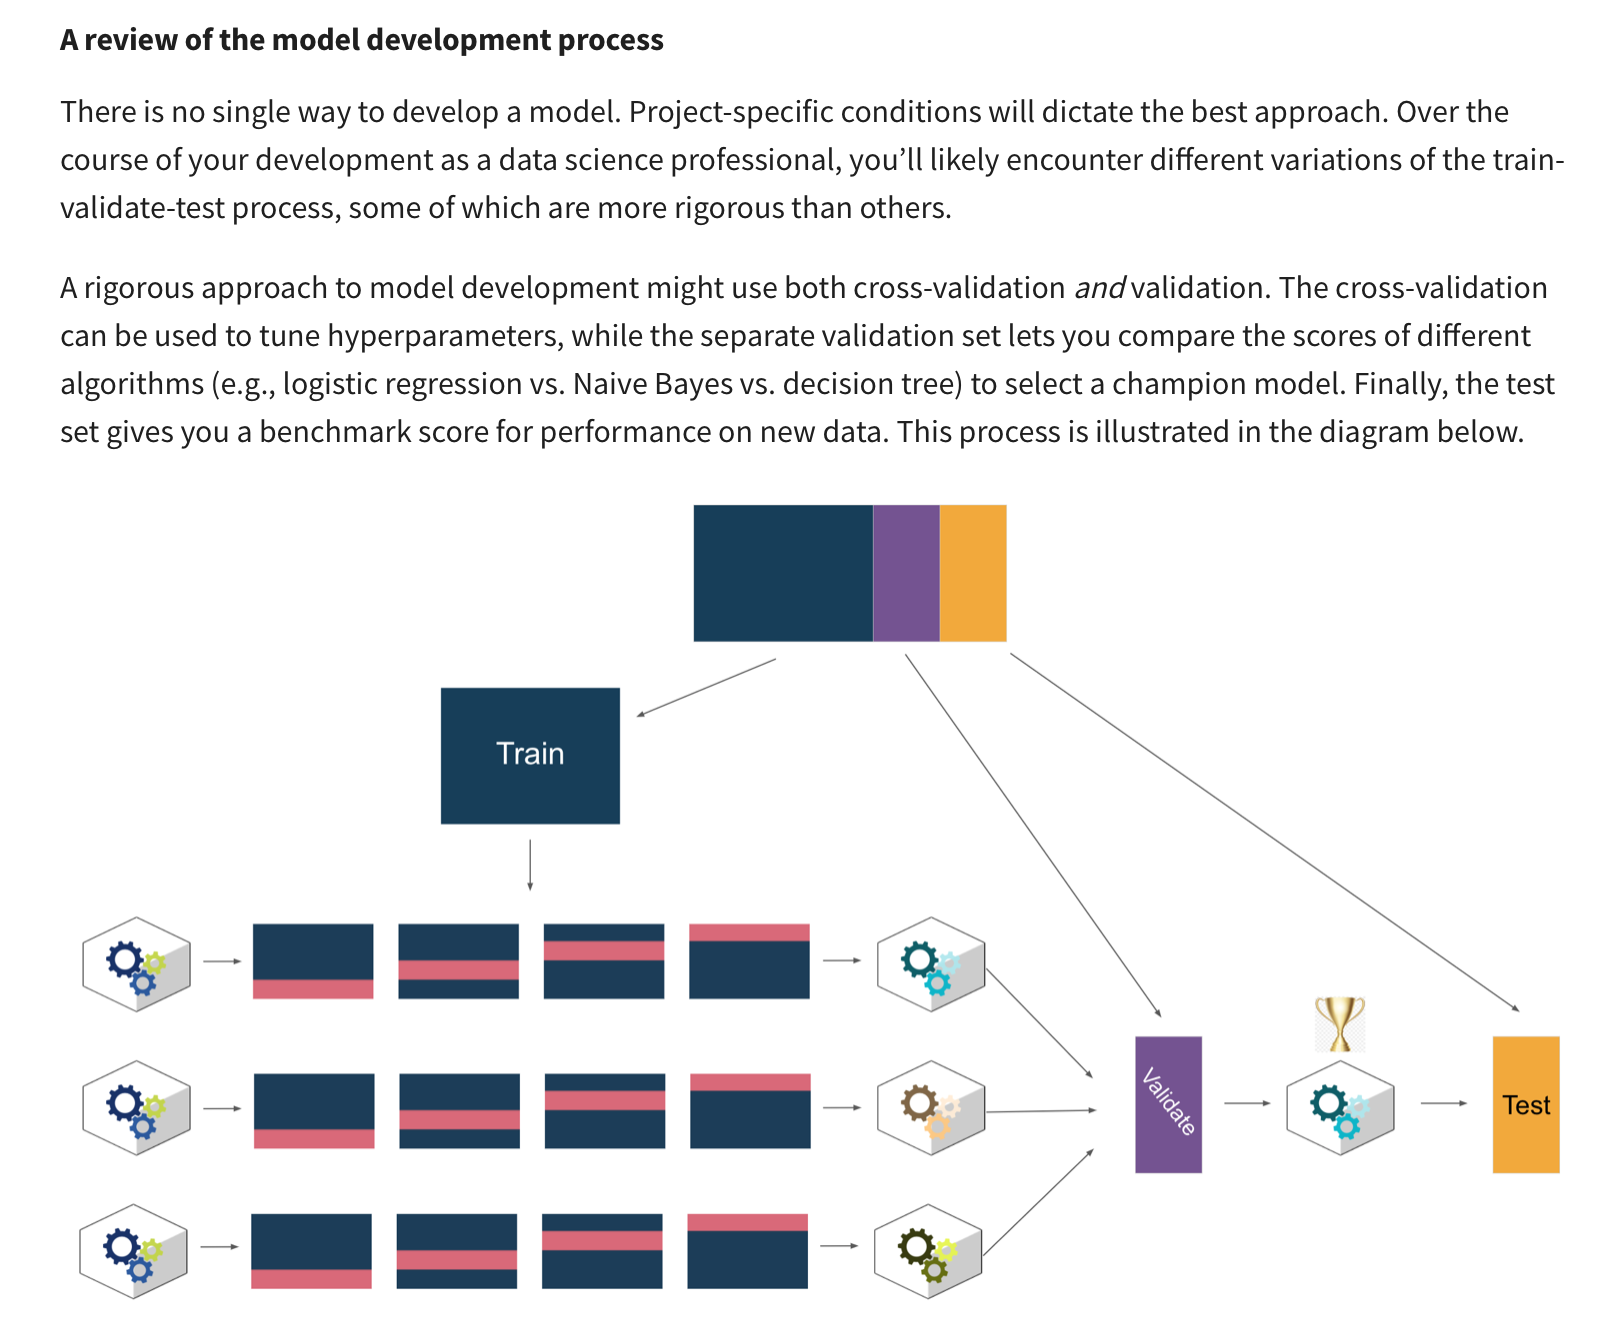
Model development process
Learn 2 use Pickle to save the trained model
- Save models
1 | with open(file_name, 'wb') as file: |
- Load models
1 | with open(file_name, 'rb') as file: |
Ensemble learning
- 同质学习器(整个过程使用同一个模型)
- Bagging(Bootstrap + Aggregating)-为了得到低方差(bias, 准确)的模型
- Random forests
- Boosting-为了得到低偏差(variance, 稳定)的模型
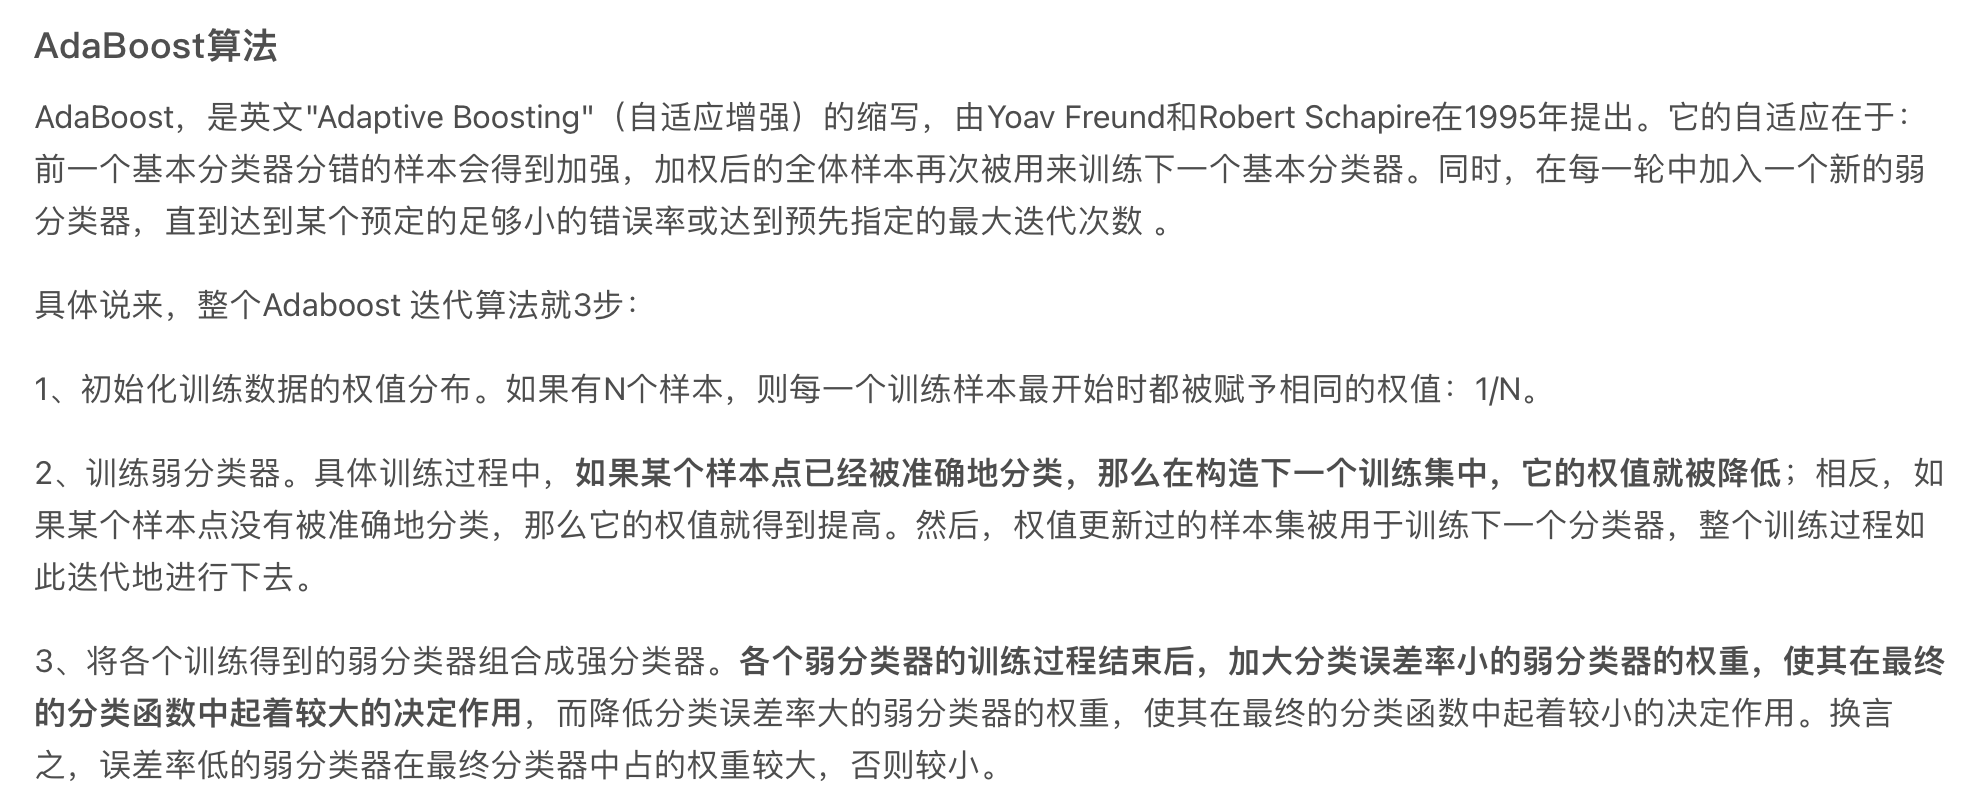
- Adaboosting
- Gradient boosting
- https://www.showmeai.tech/article-detail/193
- 下一个分类器去拟合上一个分类器产生的残差
- 残差: 分类器预测值减去上一个分类器的预测值结果
- Adaboosting
- Bagging(Bootstrap + Aggregating)-为了得到低方差(bias, 准确)的模型
- 异质学习器(使用不同模型: 逻辑回归, SVM, NN…)
- Stacking